Published by Rasiga
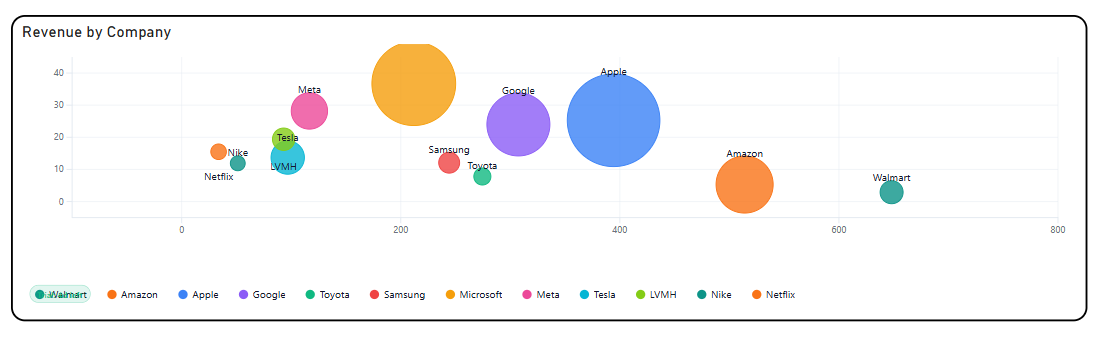
Briqlab Drill Bubble is an interactive bubble chart visualization designed to analyze relationships across multiple measures by plotting data points using position and bubble size in a single view. It enables users to compare categories across dimensions such as volume, performance, and magnitude while simultaneously revealing patterns, correlations, and outliers.
The visual supports multi-dimensional analysis by representing measures through X and Y axes, while bubble size encodes an additional quantitative value, allowing users to interpret three variables at once. Color-coded categories improve differentiation, while interactive tooltips and highlighting provide deeper insight into individual data points and their comparative contribution.
With configurable axes, bubble scaling, category grouping, and drill capabilities, Briqlab Drill Bubble is ideal for performance analysis, market comparisons, correlation analysis, portfolio evaluation, and dashboards that require an engaging visual for exploring complex relationships within data.