Published by Rasiga
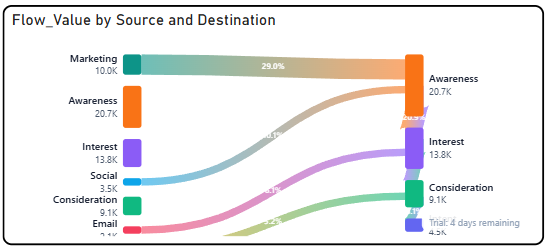
The Briqlab Flow Sankey is an interactive visualization used to display the flow and distribution of values between interconnected nodes across multiple stages or categories. Each node represents a distinct entity or category, with the width of the connecting flows corresponding to the volume or magnitude of the relationship between them, making it easy to trace how values move, split, or converge across different stages at a glance.
The chart supports multi-level flow rendering, allowing users to follow the journey of values from source nodes through intermediate stages to destination nodes simultaneously. This enables a more comprehensive understanding of how resources, quantities, or proportions are distributed and redistributed across the entire flow network.
It features automatic colour assignment for clear node and flow differentiation and supports interactive hover highlights that illuminate individual flow paths for improved traceability and readability. The visual also includes labelled nodes with value annotations, allowing users to easily quantify the contribution and receiving volume of each node within the overall flow structure.
With its dynamic and flow-driven design, the Briqlab Flow Sankey is effective for analysing resource allocation, budget distribution, customer journey mapping, and process flow breakdowns, making it an ideal tool for datasets that require a clear and detailed representation of how values transition and distribute across multiple interconnected stages.