Published by Rasiga
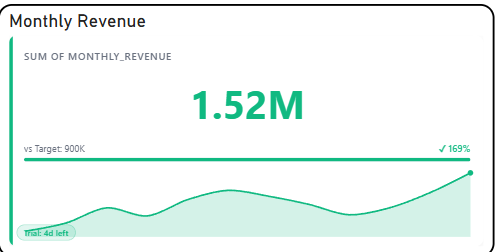
The Briqlab KPI Sparkline is an interactive visualization used to display the current value of a key performance indicator alongside a compact trend line showing its historical movement over time. Each KPI card represents a distinct metric, with its sparkline corresponding to the fluctuation and direction of values across a defined period, making it easy to monitor both the current status and recent trend of critical business measures at a glance.
The visual supports inline trend rendering, allowing users to instantly identify whether a KPI is trending upward, downward, or remaining stable through a miniature line graph embedded within the card. This enables a more contextual understanding of current performance by revealing the trajectory and momentum behind each metric.
It features automatic colour coding for clear differentiation between positive and negative trends and supports configurable labels, target values, and period selectors for improved readability. The visual also includes variance indicators and percentage change displays, allowing users to quickly assess the magnitude of shift between the current and previous period across all monitored metrics.
With its compact and insight-rich design, the Briqlab KPI Sparkline is effective for performance tracking, trend monitoring, and period-over-period comparison, making it an ideal tool for dashboards that require a quick yet meaningful overview of metric movement alongside current values.