Published
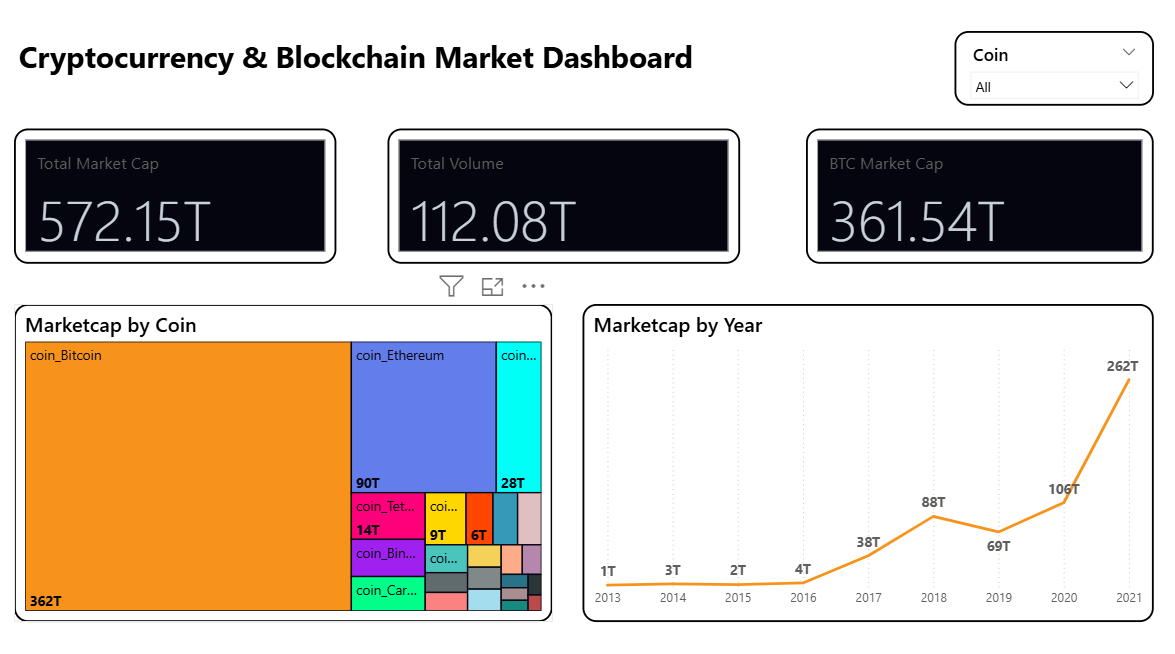
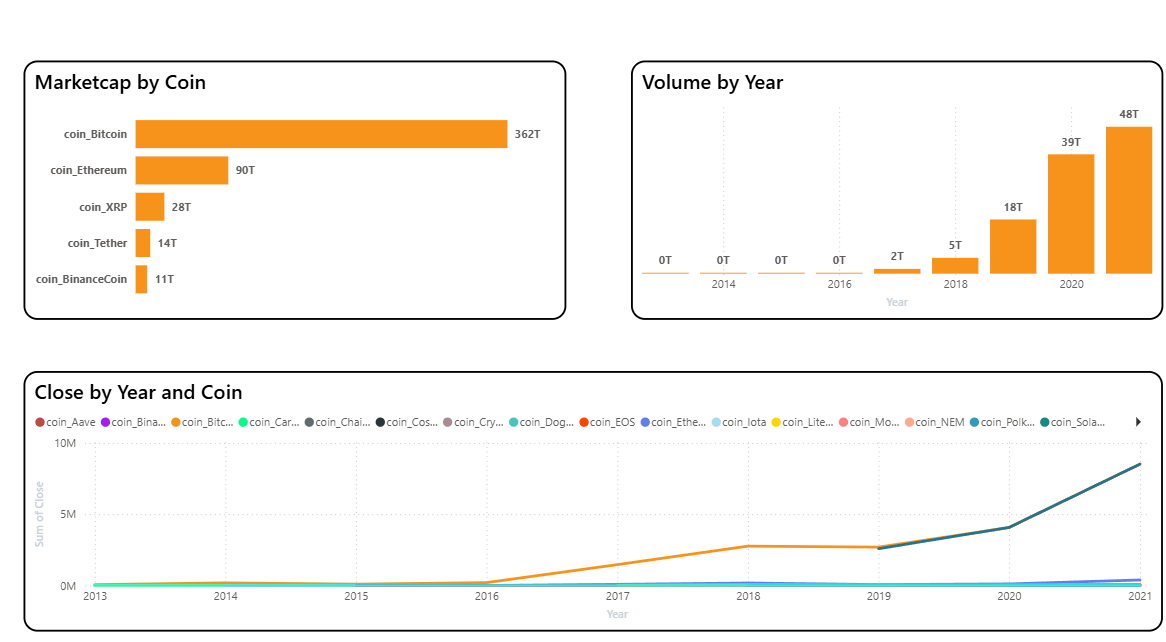
This Cryptocurrency & Blockchain Market Dashboard provides a comprehensive view of the overall crypto market by combining key financial indicators, market trends, and coin-level performance into a single interactive interface. At the top of the dashboard, essential KPIs such as total market capitalization, total trading volume, and Bitcoin market cap offer a quick snapshot of the market’s size and activity, helping users immediately understand the current state of the cryptocurrency ecosystem. The dashboard highlights the distribution of market capitalization across different cryptocurrencies, clearly showing the dominance of Bitcoin, followed by Ethereum and other altcoins. This breakdown helps users understand how market value is concentrated among major coins and how smaller cryptocurrencies contribute to the overall market structure. In addition, the dashboard presents a time-based analysis of market growth through visualizations like market cap by year and trading volume by year. These charts show a strong upward trend, especially in recent years, indicating rapid expansion and increased adoption of cryptocurrencies. The sharp rise in both market cap and volume reflects growing investor interest and market activity over time. The “Close by Year and Coin” visualization further provides a comparative view of price trends across multiple cryptocurrencies, allowing users to track how different coins have performed over the years. It highlights how certain coins have experienced significant growth while others show relatively stable or slower trends, offering insights into market dynamics and volatility. Overall, this dashboard is designed to support data-driven decision-making by providing clear insights into market dominance, growth trends, and coin-level performance. It enables users to analyze the evolution of the cryptocurrency market, compare assets, and better understand investment opportunities and risks.
Category
Templates
Chart Types
Bar, Line, Tree Map / Hierarchical Chart
Industry Types
Finance
Main Colors
#FFA500
Mode
light
Version
Pro
Total Views
6
Total Downloads
0
PBIX File
🔑 Sign in to DownloadOpen in Studio
🔑 Sign in to Open Studio
System Briqlab
System Briqlab
Skills