Published
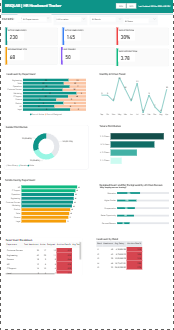
The HR Headcount Dashboard is an interactive Power BI report designed to provide a comprehensive overview of workforce metrics, enabling HR managers and leadership teams to monitor employee trends, attrition, and organizational distribution effectively. This dashboard integrates data from multiple sources, including employee master records, departmental summaries, and monthly attrition data, to deliver actionable insights. It highlights key performance indicators such as Total Headcount, Active Employees, Attrition Rate, Resignations, Average Tenure, and Employee Satisfaction. The dashboard is structured into intuitive sections, including a KPI summary strip, dynamic filter panel, and detailed visualizations. Users can analyze attrition trends by reason, understand tenure distribution across employees, and evaluate headcount distribution across bands and departments. Conditional formatting is applied to highlight critical metrics, such as high attrition rates, enabling quick identification of areas requiring attention. Interactive features such as slicers for Department, Location, Band, and Employment Status allow users to drill down into specific segments. Cross-filtering across visuals ensures seamless exploration of data, while bookmark-based navigation enhances usability. Overall, the HR Headcount Dashboard serves as a decision-support tool that empowers HR teams to identify workforce patterns, improve retention strategies, and make data-driven organizational decisions.
Interactive Demo Available
Explore this dashboard live in Power BI
Category
Templates
Chart Types
Bar, Line, Donut
Industry Types
Information Technology
Main Colors
Green
Mode
light
Version
Pro
Total Views
63
Total Downloads
2
PBIX File
🔑 Sign in to DownloadPBIT File
🔑 Sign in to DownloadOpen in Studio
🔑 Sign in to Open Studio
System Briqlab
System Briqlab
Skills