Published
This dashboard presents a clear and structured overview of video performance and engagement metrics, enabling users to quickly understand how content is performing. It brings together key indicators such as views, likes, comments, and overall engagement into a single view, making it easier to monitor performance at a glance and identify important patterns. The dashboard also focuses on time-based analysis, allowing users to observe how performance changes over days, weeks, or months. By visualizing trends through charts, users can identify peak periods of activity, understand growth patterns, and detect any fluctuations in engagement over time. In addition, the dashboard provides detailed insights into content performance by categorizing videos based on different attributes such as type, category, or channel. This helps in identifying which kinds of content attract more audience attention and generate higher engagement, supporting better content planning and strategy. Furthermore, the dashboard includes comparative visualizations that allow users to evaluate and compare the performance of different videos or categories. These comparisons help highlight top-performing content and reveal areas that may need improvement. Overall, the dashboard is designed to support data-driven decision-making by presenting complex data in a simple and interactive format. It helps users analyze trends, understand audience behavior, and optimize content strategies effectively.
Category
Templates
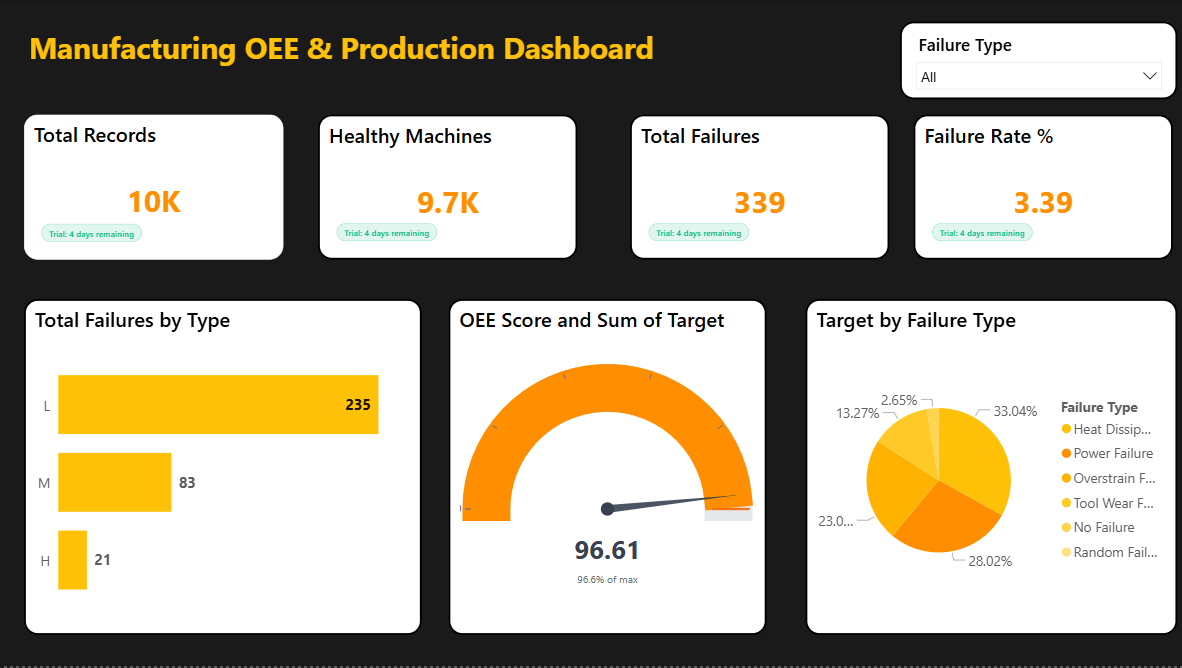
Chart Types
Bar, Pie, Gauge
Industry Types
Finance, Retail
Main Colors
Yellow
Mode
dark
Version
Free
Total Views
6
Total Downloads
1
PBIX File
🔑 Sign in to DownloadOpen in Studio
🔑 Sign in to Open Studio
System Briqlab
System Briqlab
Skills