Published
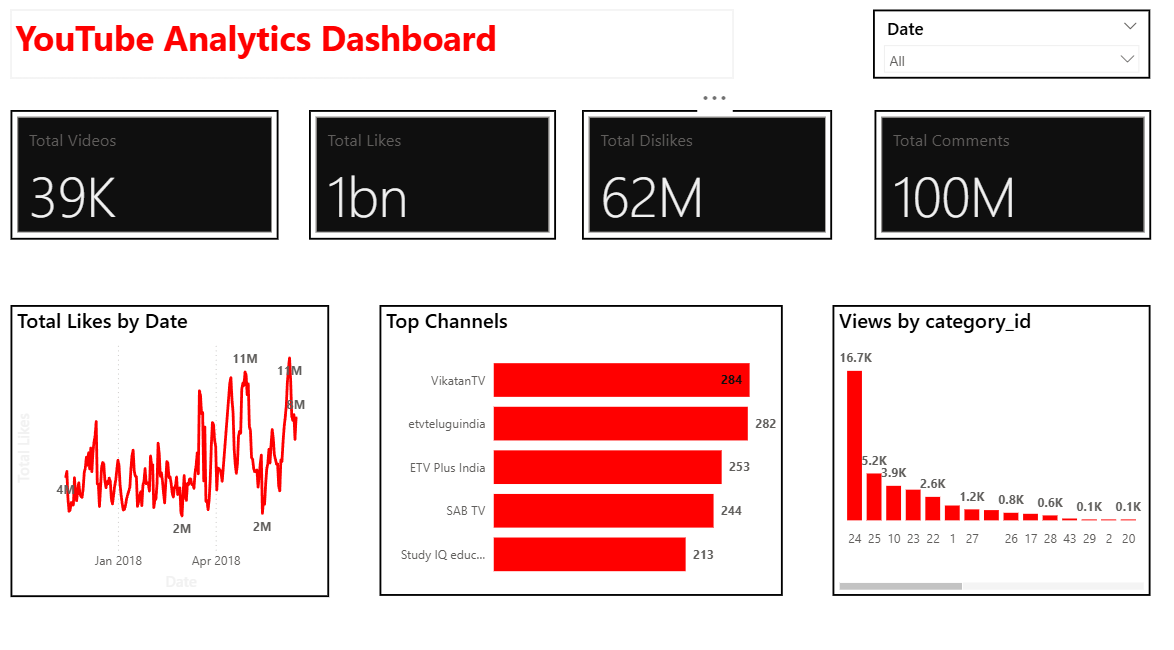
This YouTube Analytics Dashboard provides a comprehensive overview of video performance and audience engagement metrics, helping users understand how content is performing across the platform. At the top of the dashboard, key performance indicators such as total videos, total likes, total dislikes, and total comments offer a quick snapshot of overall channel activity and audience interaction. The dashboard includes a time-based analysis of likes, which shows how audience engagement evolves over a selected period. The line chart highlights fluctuations and peaks in likes, allowing users to identify periods of high engagement and understand trends in viewer response over time. In addition, the dashboard presents insights into top-performing channels by comparing total engagement metrics. This helps identify which channels generate the highest interaction and can be useful for benchmarking performance or analyzing successful content strategies. The “Views by Category” section further breaks down performance across different content categories, showing which types of videos attract the most views. This enables users to understand audience preferences and focus on categories that drive higher visibility and engagement. Overall, the dashboard is designed to support data-driven decision-making by presenting complex YouTube data in a clear and interactive format. It helps users track performance trends, evaluate channel effectiveness, and optimize content strategies to maximize audience reach and engagement.
Category
Templates
Chart Types
Bar, Line
Industry Types
Information Technology
Main Colors
Red
Mode
light
Version
Free
Total Views
17
Total Downloads
2
PBIX File
🔑 Sign in to DownloadOpen in Studio
🔑 Sign in to Open Studio
System Briqlab
System Briqlab
Skills